Organizational Level Analytics
📔 Overview
This article provides guidance on viewing organizational level analytics within your organization, enabling you to examine various data concerning content and projects. This article will focus on event reporting and project reports:
Event reporting provides analytics such as who has accessed your projects, who has been reviewing content, and time parameters.
Project reports offer tailored analytics for tracking progress on projects with implemented plans.
📘 Instructions
Follow the step-by-step instructions below to view event reporting and project reports.
Access the Organizational Control Center
Access the Organizational Control Center on the home view by clicking on the house icon on the left side.
Then on the upper right side of the home view, click on the Menu button, and then select Org Control Center:
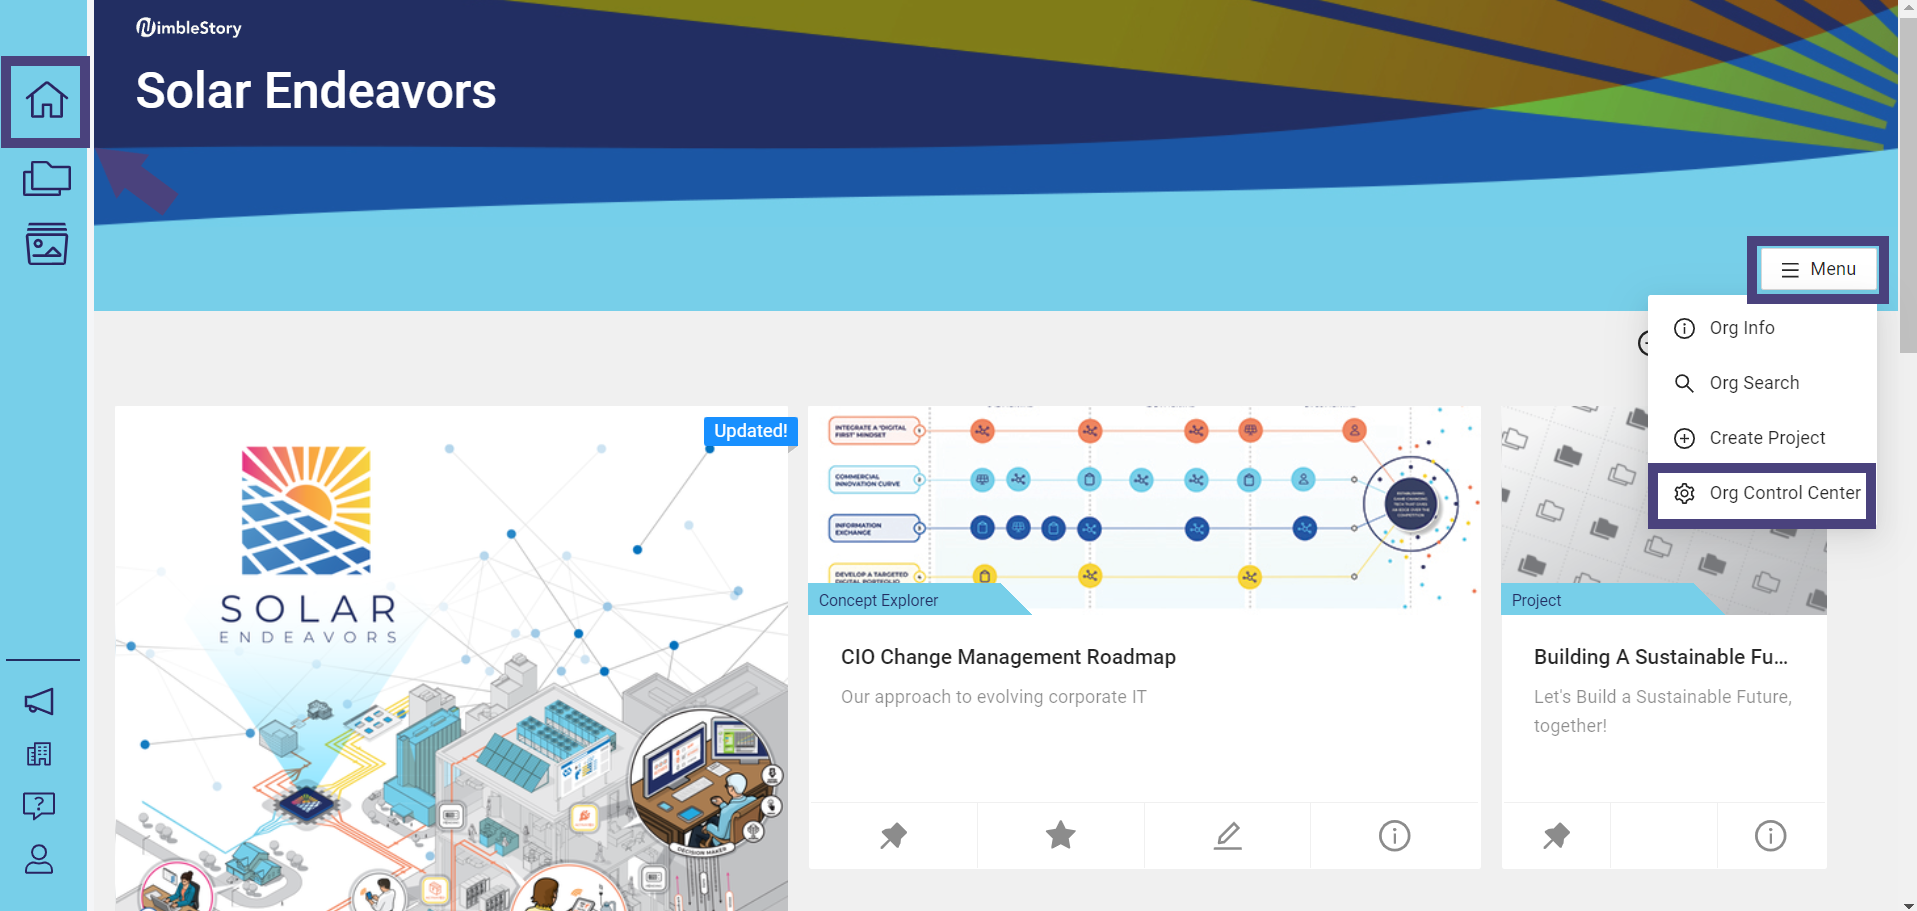
To be able to access the organizational control center where analytics are housed, you will need to have the “Org Admin” permission. If you do not see this option, please email support@nimblestory.com.
View Event Reporting
On the Manage My Organization control center page, click on Event Reporting (no information is loaded by default). Select the options you want for event reporting by clicking on each drop down box below the option:
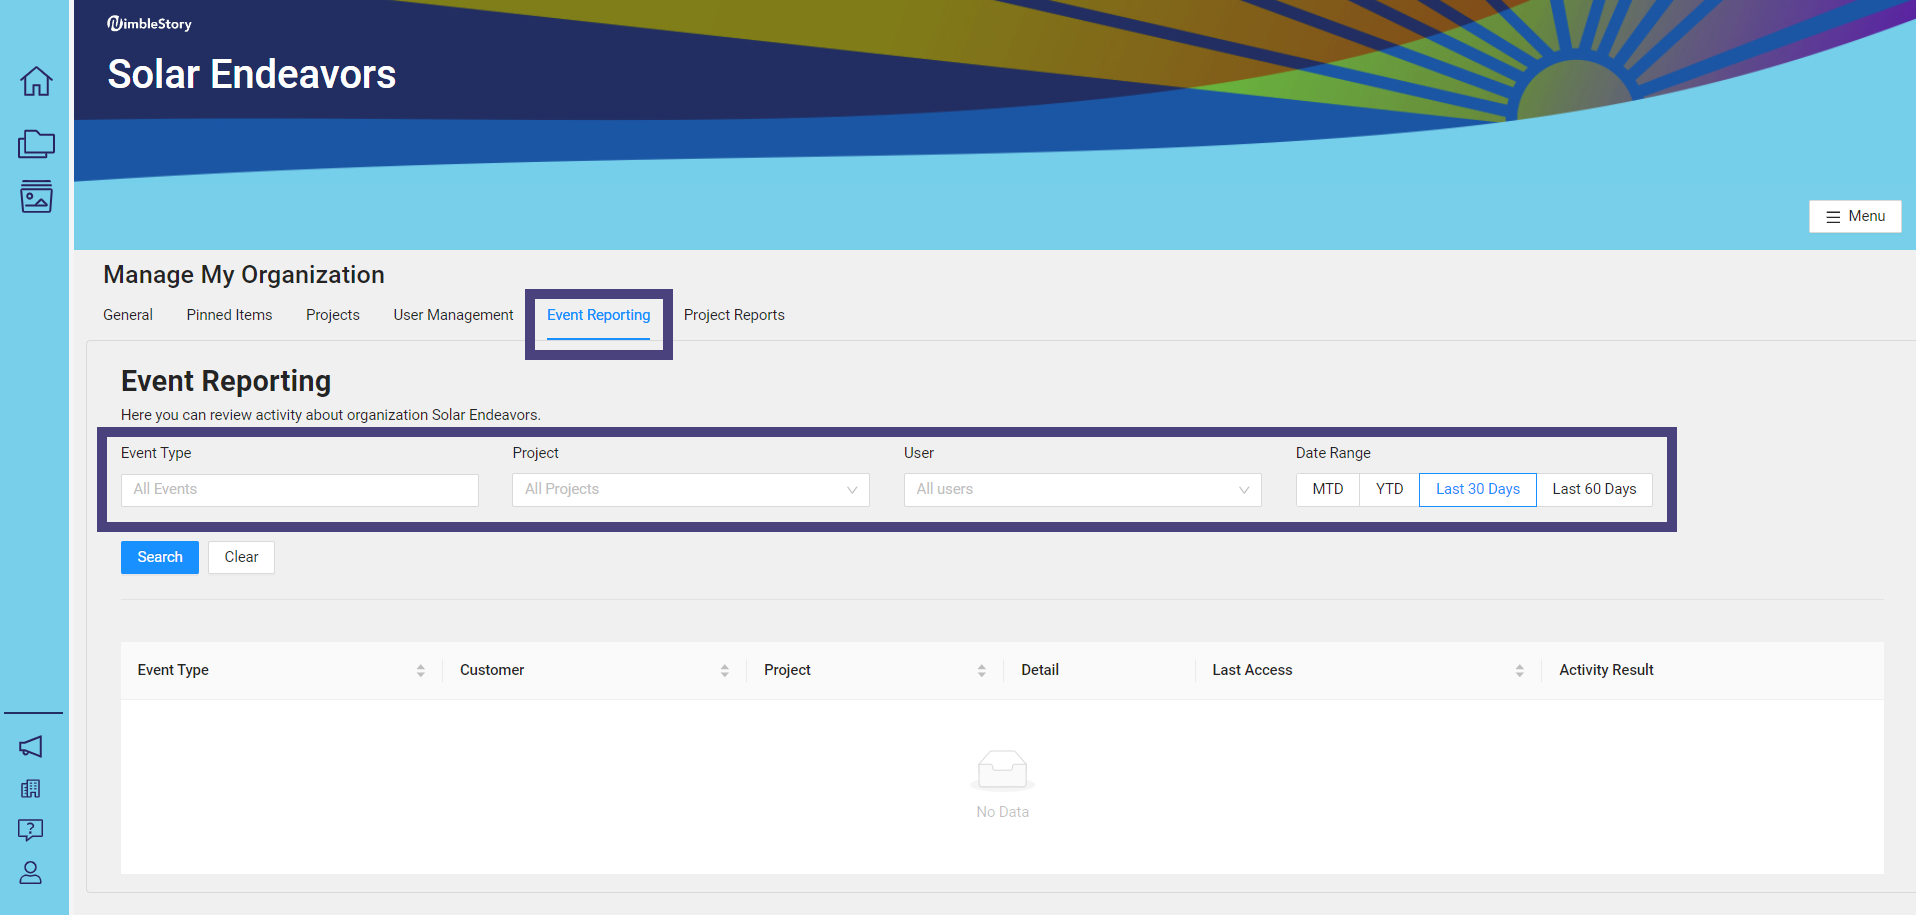
Event Type:
List of the different types of content that may be available within your organization including content creation dates, user event reviews, project specific related events, as well as portfolio and perspective events.
Certain options are nested so selecting the top level option will automatically populate the information with each sub option.
Project:
List of projects available within your organization.
Scroll down to select a specific project or leave this option empty to view information across all projects.
User:
List of users within your organization.
Default is set to All Users.
Date Range:
MTD = Month to Date.
YTD = Year to Date.
Last 30 Days (Default).
Last 60 Days.
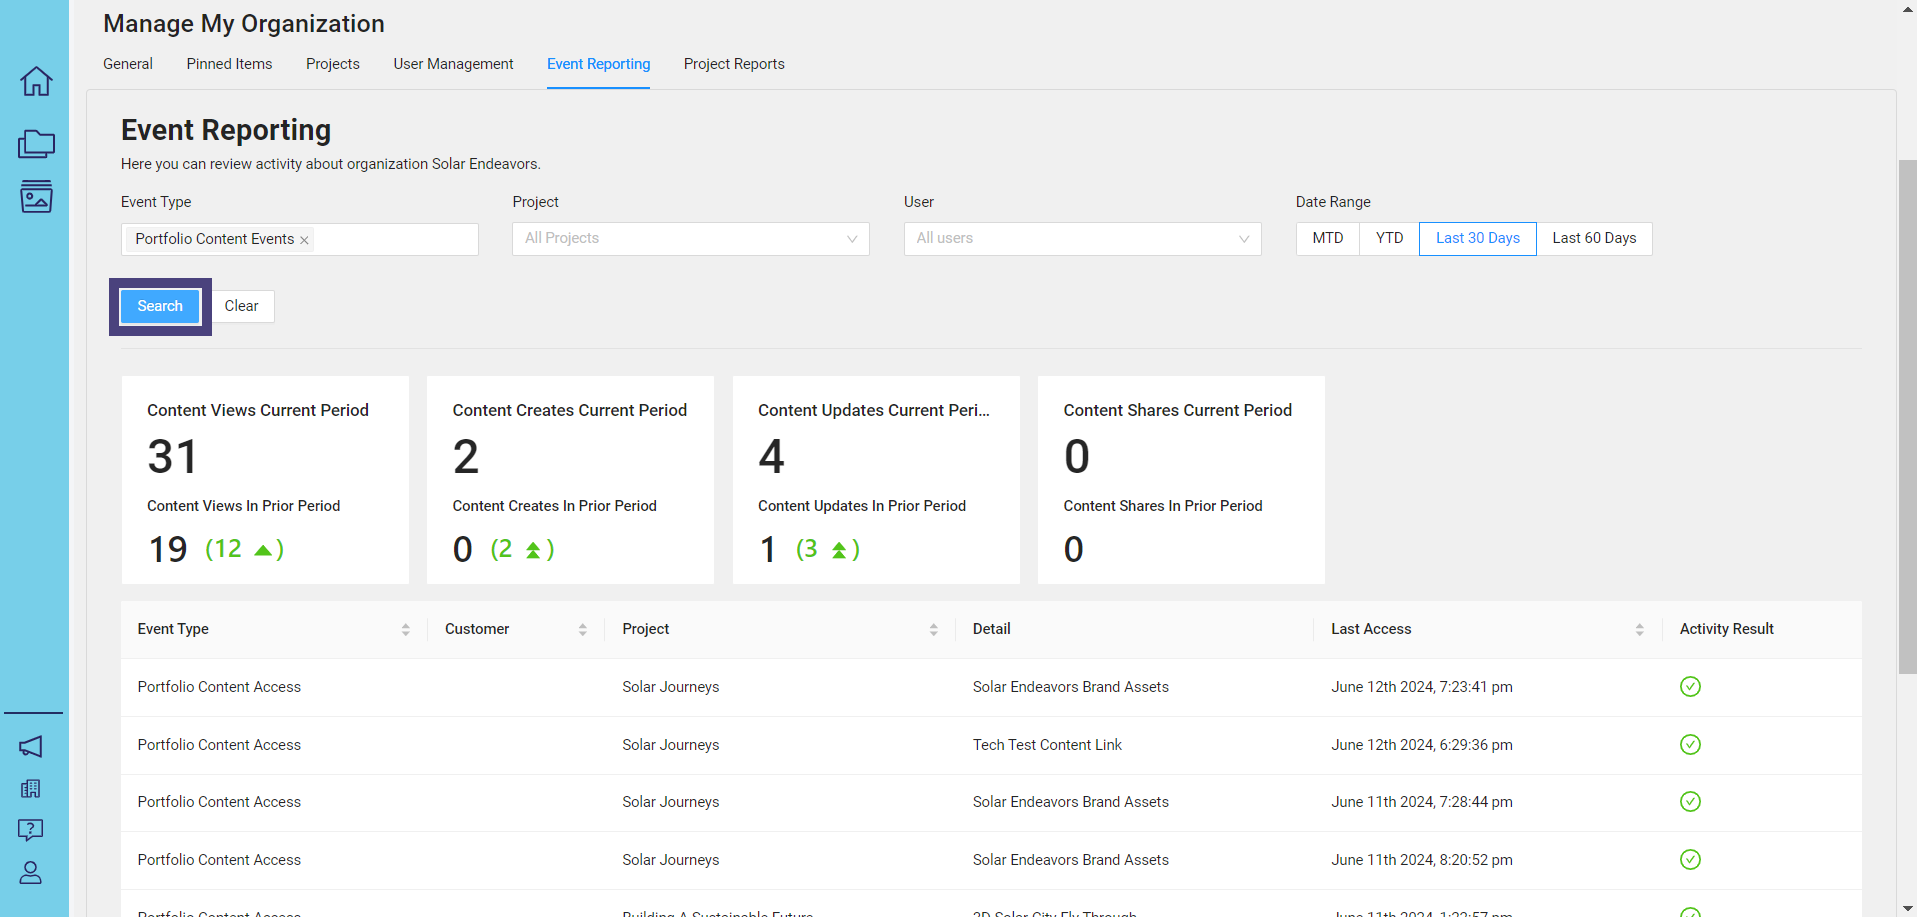
Once you have populated your options, click on the Search button and your results will appear within the data cards and table (example below):
View Project Reports
On the Manage My Organization control center page, click on Project Reports (no information is loaded by default). To load a report, select your criteria/filter using the buttons provided:
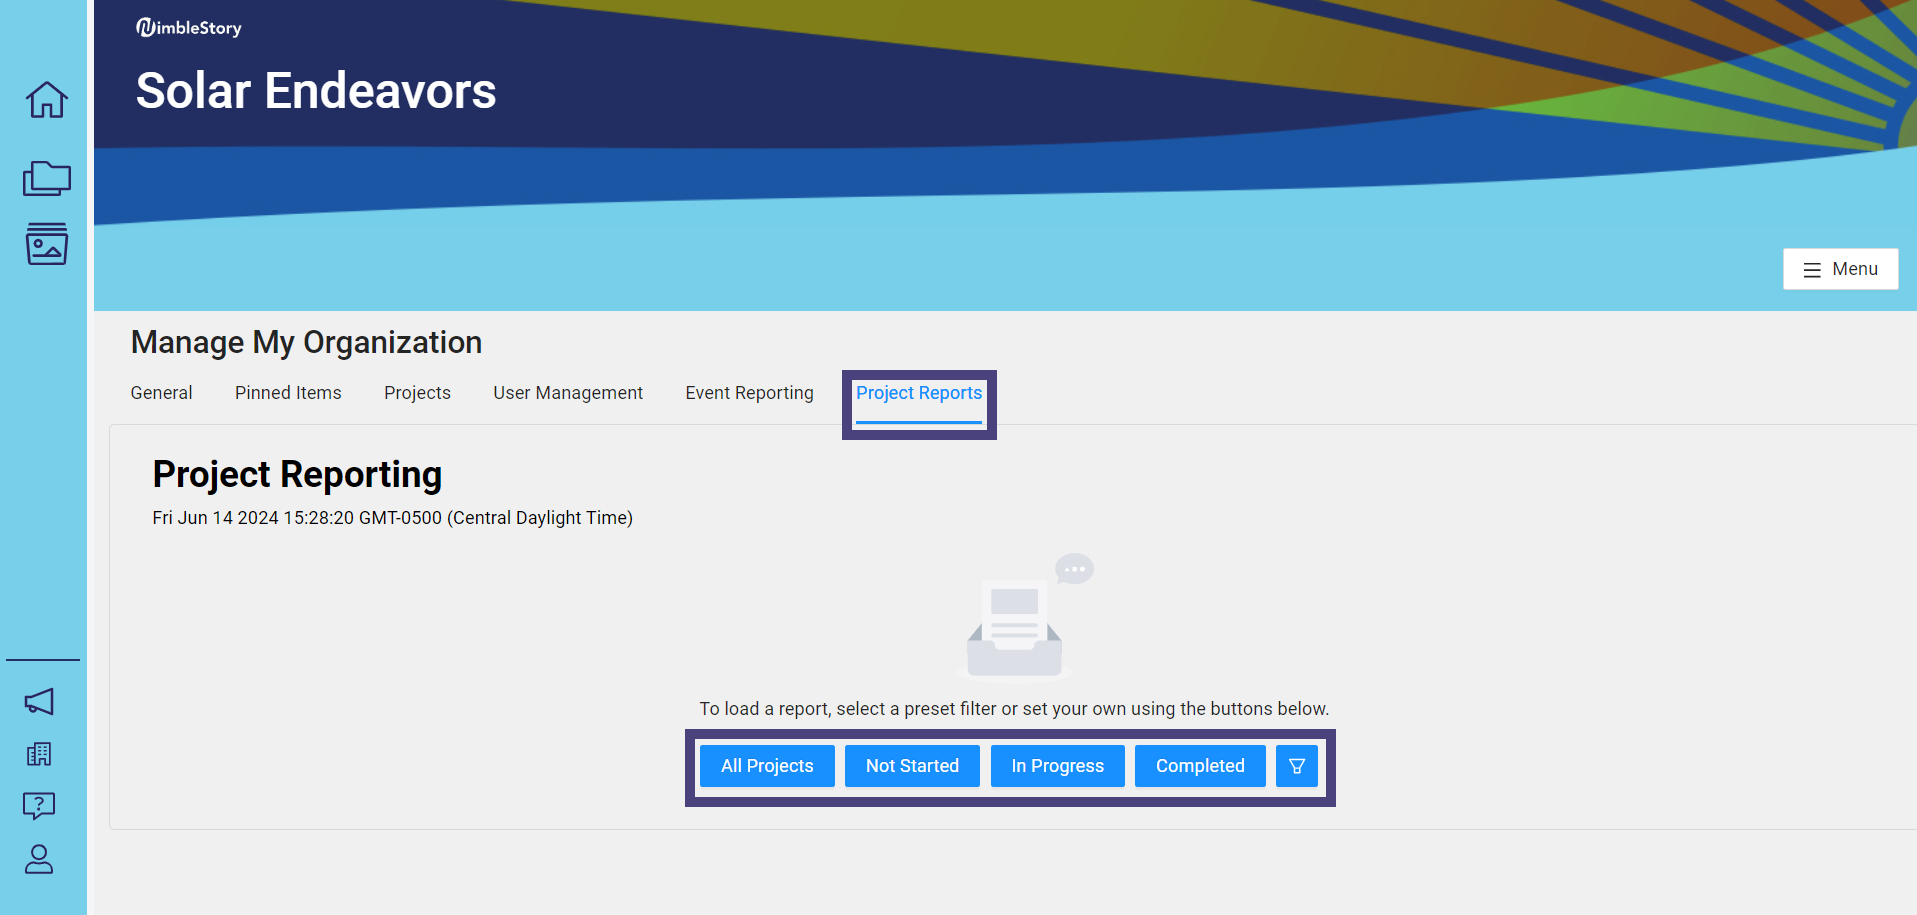
Your results will appear within the data cards and table (example below):
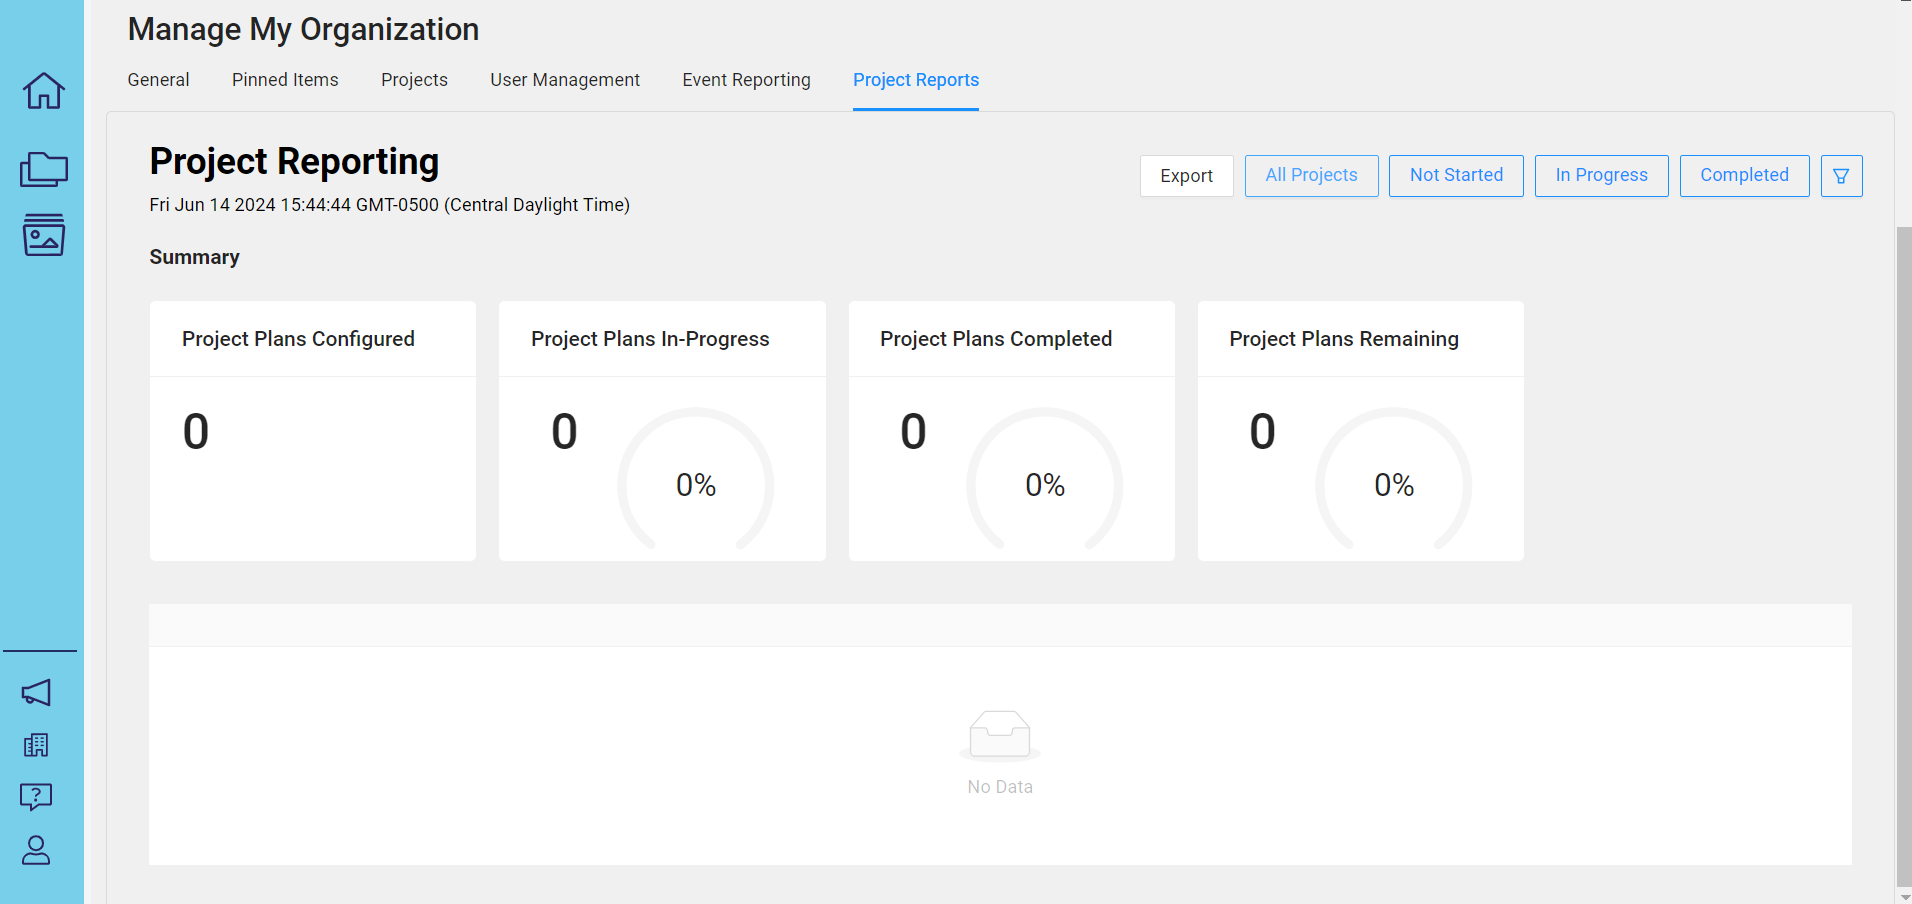
The time taken for project reporting results to appear may vary, ranging from a few seconds to a few minutes, depending on the volume of information the system needs to process.
Audience | Public |
Section | NimbleStory Basic |
Status | Rough Draft |
Applies to | NimbleStory 3.0 and higher |
Next Review Date | Nov 2022 |
| Version | Date | Comment |
|---|---|---|
| Current Version (v. 5) | Jun 23, 2024 21:05 | @a user |
| v. 4 | Jun 14, 2024 20:56 | @a user |
| v. 3 | May 16, 2024 21:57 | @a user |
| v. 2 | May 16, 2024 21:49 | @a user |
| v. 1 | May 10, 2024 18:50 | @a user |
